Zima Weather: a Story

Origins
I started Zima Weather in December 2020 by being inspired with the following Animated Weather Cards codepen:
See the Pen Animated Weather Cards by Steve Gardner (@ste-vg) on CodePen.
My idea was to make a smart dashboard that would be displayed constantly at home with Raspberry PI and a dedicated screen, so that I do not need to look at my phone for some frequent weather info that I forget after five seconds.
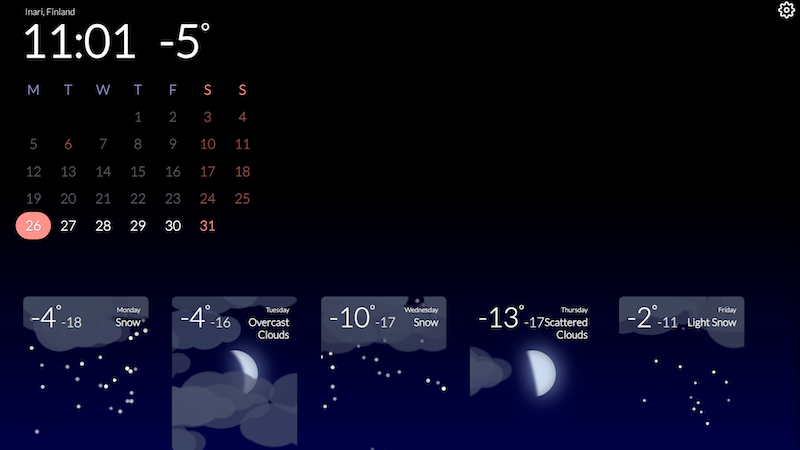
My design idea was a weather card for each day starting from today, total five cards/days in a row, and a calendar and time on top.
Initially named simply Weather Dashboard, I made my first commit to the repo on December 2020, and you can find my original source repo on https://github.com/dragoon/starport
After some time, I added sunset/sunrise colors bound to actual sunset/sunrise time using another great codepen:
See the Pen CSS Sunset Sunrise by Marty (@msaetre) on CodePen.
I removed the sea, adjusted corresponding sun positions, etc.
PIXI.JS
There was a major problem though – the original codepen implemented all weather effects like rain, snow, clouds, etc. as SVG objects and animated them. This was more or less okay with one card on a desktop computer, but extremely heavy with five cards on Raspberry PI – around 15 FPS.
I checked around and found Pixi.JS – a fast canvas/WebGL rendering library. I spent several months rewriting all SVG shapes and animations to PIXI, and upgrading TweenMax to GSAP 3. Luckily, I could at least keep GSAP object animations as it offered a PIXI plugin. I generated objects/shapes directly in PIXI at first – lines for rain, circles for snow, but this was also not the most performant method in PIXI, so I also migrated all objects into a spritesheet.
That almost doubled the performance on PI, to 30 FPS. Then I found that disabling antialiasing in PIXI can get me additional 5-10 FPS.
Raspberry PI
The largest boost in performance on raspberry came not from my optimizations though, but from uninstalling various desktop stuff. I used a full desktop version originally, and when I removed everything apart from X11 and a simple openbox window manager, it got my dashboard to 50-60 FPS, which was more than enough.
Backend
On the backend, I used python's FastApi and OpenWeatherMap API to get the weather forecasts and Heroku for deployment. I know Heroku has lost a lot of its early day charm, but I still use it for my personal projects as I feels very familiar and predictable.
Frontend
At this point, dashboard started to take shape, I added time and calendar, and setup a publishing process through CloudFlare pages:
Next steps
With the dashboard looking more or less okay and not too slow, I decided to give a try publishing it in some of the stores to see if gets any traction with other people.